
The S&P 500 finished the first quarter higher by over 10%; its fifth positive quarter in the last six. The S&P is now up 50% since the lows in late 2022, a stunning gain. While not all sectors of the S&P 500 have participated in this massive rally thus far, more are joining the party. Some familiar themes such as AI and GLP-1s helped Nvidia and Eli Lilly continue their 2023 momentum, but new leadership also emerged from oil refiners, miners, machinery, homebuilders, and railroads. These industries are sensitive to the economic cycle, and their leadership is consistent with a trend we are seeing; the economy is doing pretty good.
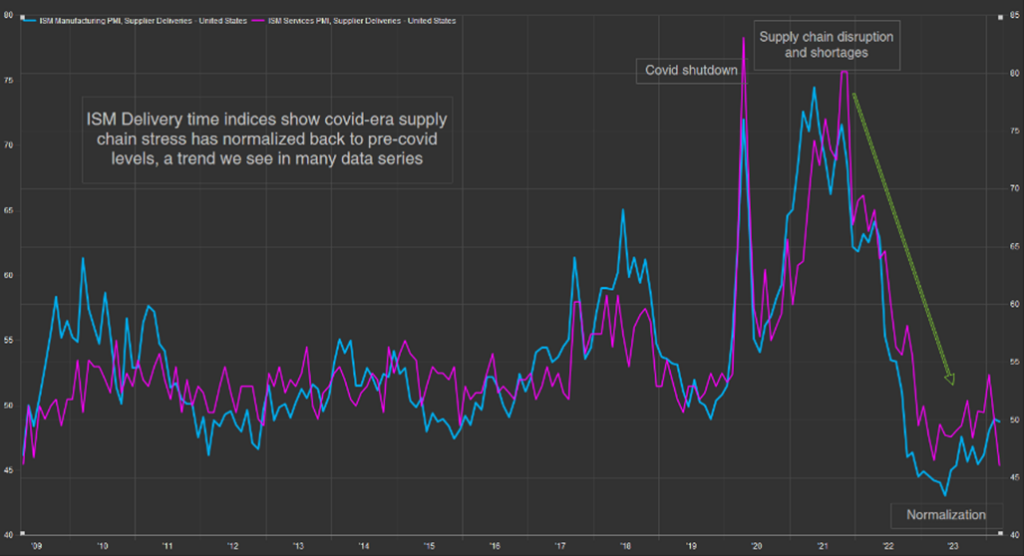
GDP estimates for Q1 will be released on April 25th, and economists surveyed expect growth of 3.1% over Q1 last year, the same rate GDP grew in 2023 and higher than the average during the 2010s, 2.4%. Even more interesting, we are seeing normalization across recent strong and weak industries. Manufacturing, which has been in decline since October of 2022, troughed in mid-2023 and as of March, is growing again. Inventories, which were historically low in 2021 and 2022, are now “just right” according to respondents to ISM surveys, and delivery times. have shortened to pre-covid levels, indicating less strain on supply chains. (See Chart Below)
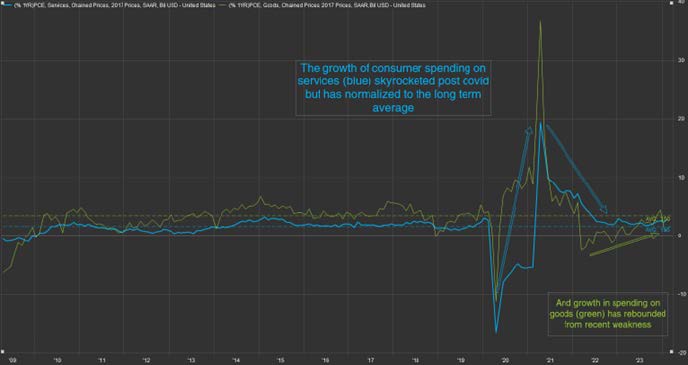
Consumer spending on goods, which declined in 2022, has now rebounded and its growth is accelerating (see chart below). This “back to the average” trend is happening across housing, industrial production, wages, job openings/quit rates, and trucking. To us, it seems like the economy is on a path to normalize back to its pre-Covid/post-Financial Crisis conditions, which by the way, was the longest expansion in U.S. history and delivered over 500% return from the S&P 500, according to YCharts data.
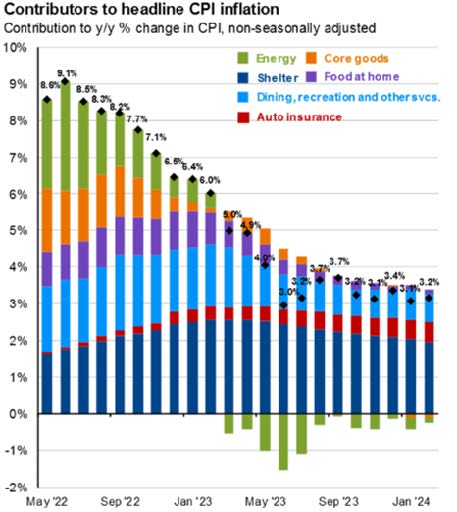
Economic strength is always good news for equity investors, but sometimes it doesn’t seem that way. Inflation has been stuck in the low 3s since last summer, and a strong economy puts upward pressure on prices. Inflation is not happening everywhere though. March CPI report from the U.S. Bureau of Labor Statistics showed over 60% of core inflation in the last year is from higher shelter prices, up 5.7%. Other categories pushing inflation higher are auto insurance (up 22%) and food away from home (up 4.2%); according to our internal calculation, these three items account for 78% of total inflation. In fact, many categories are experiencing deflation including appliances, food at home items like cereal, ham, and eggs, fuel oils (ex-gasoline), furniture, tools, used cars, electronics, and many others. The chart below shows contributors to inflation over the past several months. This is significant progress from the pervasive inflation we experienced over the past couple of years, but not significant enough for the Federal Reserve.
Voting members of the Fed’s policy setting committee have noted that due to a strong economy and its effect on prices, there may not be a need to cut rates this year; a departure from their March 20th projection of three 25-bps cuts before year end. This caused rates to shoot higher and increased volatility in equity and bond markets; however, I view the most recent Fed pivot as a net positive for investors because it signals health in the overall economy. The Fed has the flexibility to be patient with normalizing interest rates because the economy has thus far handled higher rates well.
Even if inflation hovers around 3-4%, this is indicative of 3-4% average revenue growth for stocks, and higher earnings. Even though interest rates continue to drift higher, leading to lower bond prices, we believe the stability and behavior of bonds makes them a crucial part of a balanced portfolio. Just because the future looks bright does not mean it will be smooth sailing, and bonds act as a “risk-off” asset for a variety of downside catalysts, including recession, geopolitical turmoil, and sharp spikes in volatility.
Furthermore, we have recommended an overweight to short-term bonds since October of 2022 to manage interest rate risk. Short-term bond prices have a third of the volatility of traditional bonds (which have a third of the volatility of the S&P) and are yielding more than long-term bonds, giving investors reliable positive returns. The stronger than expected economy began to boost stocks in October 2022, and the S&P is up 32% annualized since that trough, according to YCharts. In just the last five months, the S&P 500 is up 28%; mid and small caps are up over 30%. The S&P 500’s price to earnings ratio, an often quoted metric used to assess market valuation, is significantly above its long-term average.
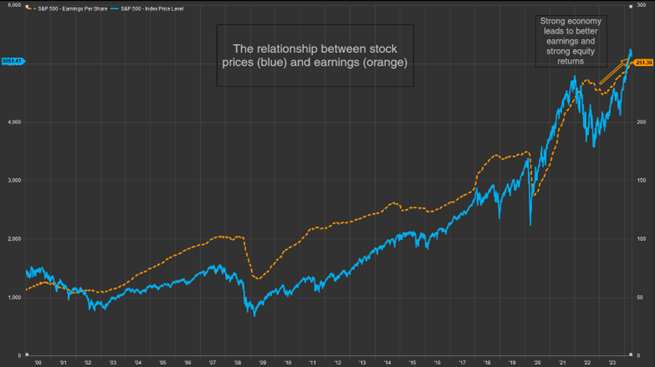
Measures of market volatility, such as the VIX, are low, and investors are the most bullish since January of 2021. This has created hesitation among investors to stay invested or put new capital to work in the market. However, we caution you against allowing recent gains, or expensive valuations, to prevent you from sticking to your financial plan. The economy is growing at a steady and sustainable rate, which leads to steadily growing corporate earnings, which is what stock prices follow beyond the short run. (See Chart Above)
Over the last 3-4 decades, expansions have gotten longer, and recessions have gotten shorter, meaning a quicker rebound and longer runway for earnings growth. Corporate earnings, which troughed in Q1 2023, are expected to grow 11% in 2024 and 14% in 2025. Market prices don’t follow earnings perfectly over the short term, and 5-10% corrections are not uncommon throughout bull markets, but economic strength sustains earnings growth, which supports long-term market returns. Investors should keep their eye on the long-term earnings growth picture and resist trying to time market corrections. As legendary portfolio manager Peter Lynch said, “Far more money has been lost by investors trying to anticipate corrections than lost in the corrections themselves.”
Jeff Cone, CFA®, CAIA®
Chief Investment Officer

The views expressed represent the opinions of Benedetti, Gucer & Associates. as of the date noted and are subject to change. These views are not intended as a forecast, a guarantee of future results, investment recommendation, or an offer to buy or sell any securities. The information provided is of a general nature and should not be construed as investment advice or to provide any investment, tax, financial or legal advice or service to any person. The information contained has been compiled from sources deemed reliable, yet accuracy is not guaranteed. Additional information, including management fees and expenses, is provided on our Form ADV Part 2 available upon request or at the SEC’s Investment Adviser Public Disclosure website. www.adviserinfo.sec.gov.
Past performance is not a guarantee of future results.